Evolutionary Coupling Analysis
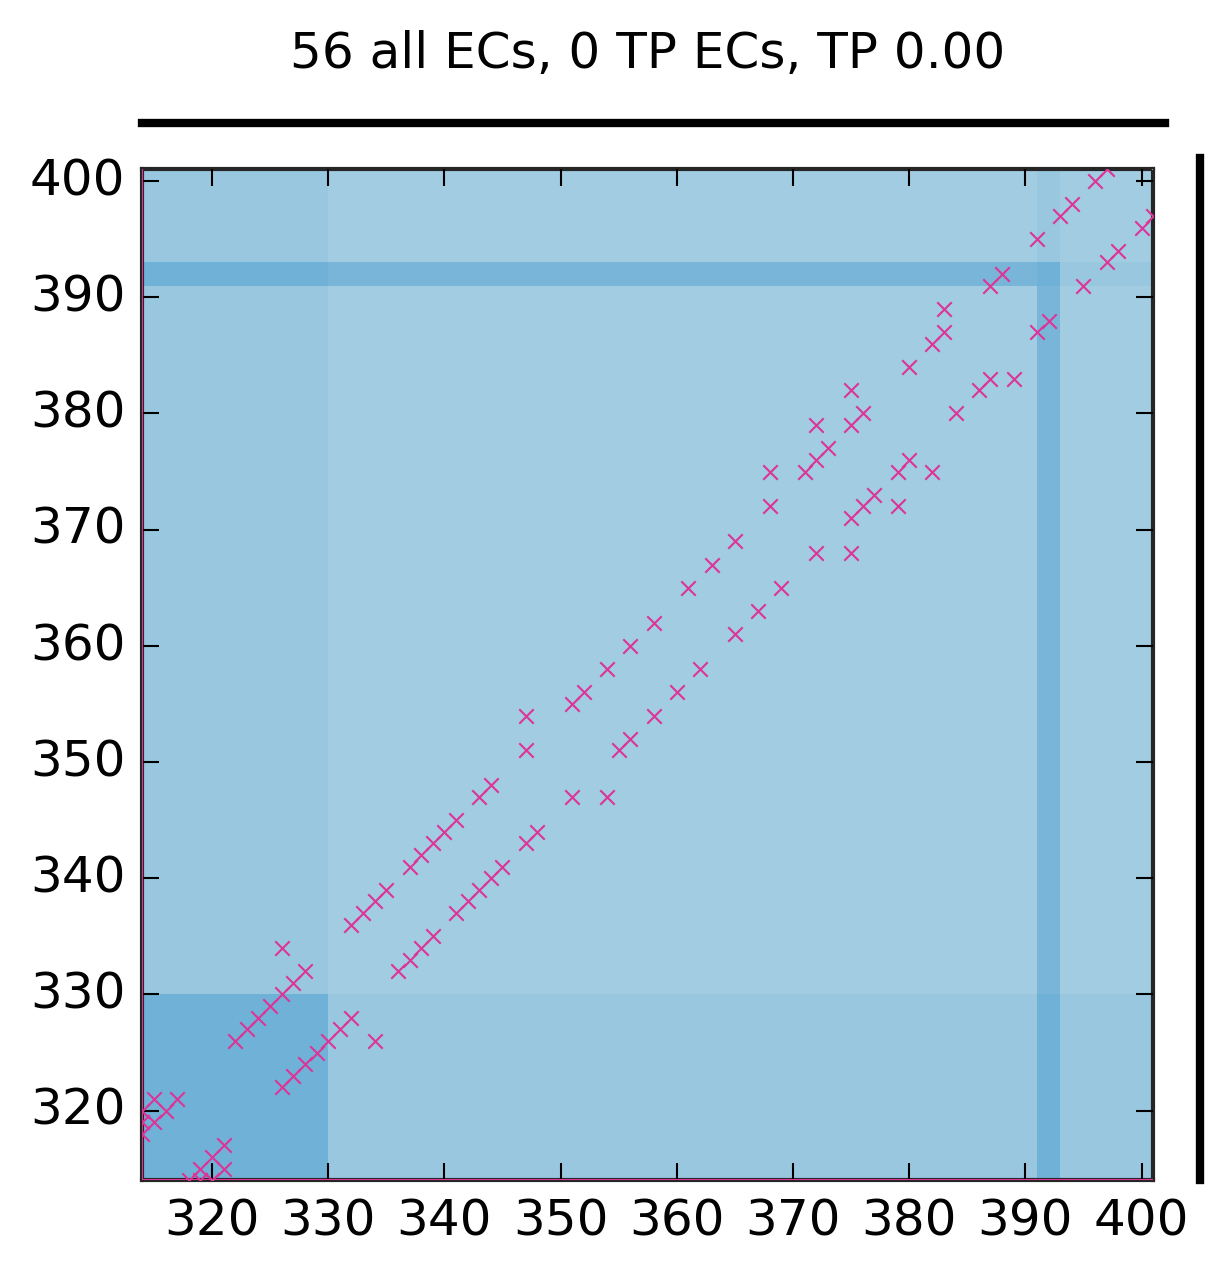
Predicted and experimental contacts
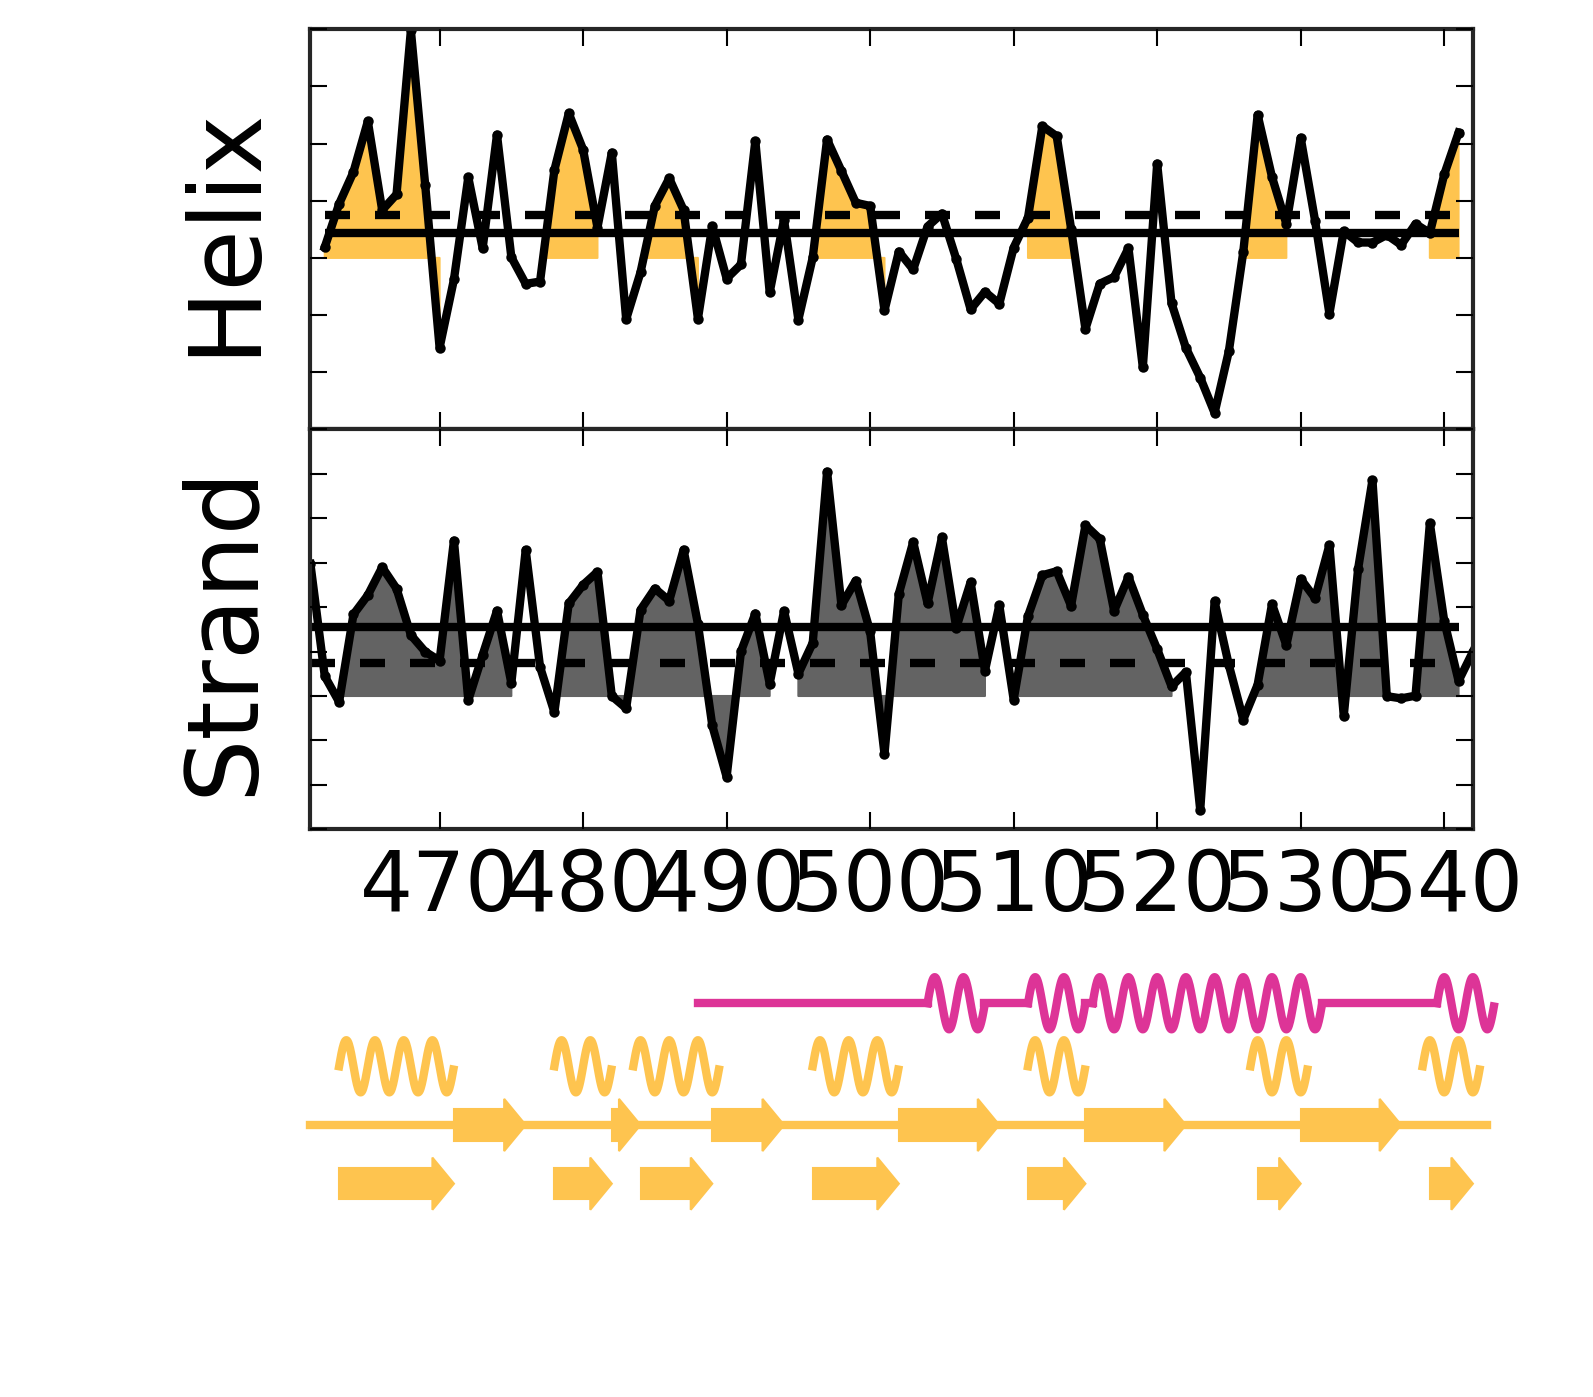
Secondary structure from ECs
EC score distribution and threshold
Top ECs
| Rank |
Residue 1 |
Amino acid 1 |
Residue 2 |
Amino acid 2 |
EC score |
| 1 |
466 |
A |
470 |
P |
0.61 |
| 2 |
538 |
K |
543 |
M |
0.58 |
| 3 |
463 |
L |
467 |
M |
0.51 |
| 4 |
477 |
E |
481 |
D |
0.50 |
| 5 |
478 |
N |
482 |
E |
0.49 |
| 6 |
465 |
T |
473 |
A |
0.45 |
| 7 |
530 |
A |
535 |
E |
0.44 |
| 8 |
462 |
E |
466 |
A |
0.43 |
| 9 |
539 |
T |
543 |
M |
0.43 |
| 10 |
472 |
V |
476 |
A |
0.43 |
| 11 |
490 |
A |
494 |
L |
0.43 |
| 12 |
541 |
N |
545 |
H |
0.42 |
| 13 |
535 |
E |
541 |
N |
0.42 |
| 14 |
525 |
L |
529 |
L |
0.42 |
| 15 |
536 |
S |
542 |
D |
0.41 |
| 16 |
539 |
T |
545 |
H |
0.40 |
| 17 |
496 |
A |
500 |
A |
0.40 |
| 18 |
525 |
L |
531 |
N |
0.39 |
| 19 |
464 |
K |
468 |
S |
0.39 |
| 20 |
480 |
Q |
484 |
D |
0.39 |
| 21 |
495 |
R |
499 |
M |
0.39 |
| 22 |
465 |
T |
469 |
T |
0.39 |
| 23 |
528 |
E |
532 |
A |
0.39 |
| 24 |
481 |
D |
489 |
E |
0.39 |
| 25 |
480 |
Q |
487 |
G |
0.39 |
| 26 |
514 |
K |
522 |
L |
0.38 |
| 27 |
524 |
A |
539 |
T |
0.38 |
| 28 |
533 |
R |
537 |
K |
0.37 |
| 29 |
531 |
N |
541 |
N |
0.37 |
| 30 |
476 |
A |
480 |
Q |
0.37 |
| 31 |
490 |
A |
496 |
A |
0.37 |
| 32 |
531 |
N |
539 |
T |
0.37 |
| 33 |
470 |
P |
474 |
E |
0.36 |
| 34 |
510 |
T |
514 |
K |
0.36 |
| 35 |
516 |
E |
520 |
K |
0.36 |
| 36 |
525 |
L |
532 |
A |
0.35 |
| 37 |
533 |
R |
540 |
A |
0.35 |
| 38 |
536 |
S |
543 |
M |
0.35 |
| 39 |
461 |
A |
465 |
T |
0.35 |
| 40 |
537 |
K |
543 |
M |
0.34 |
| 41 |
467 |
M |
471 |
H |
0.34 |
| 42 |
524 |
A |
535 |
E |
0.34 |
| 43 |
529 |
L |
533 |
R |
0.34 |
Alignment robustness analysis
First most common residue correlation
Second most common residue correlation